
NBA Betting Models: Creating Data-Driven Prediction Systems
 Available in US
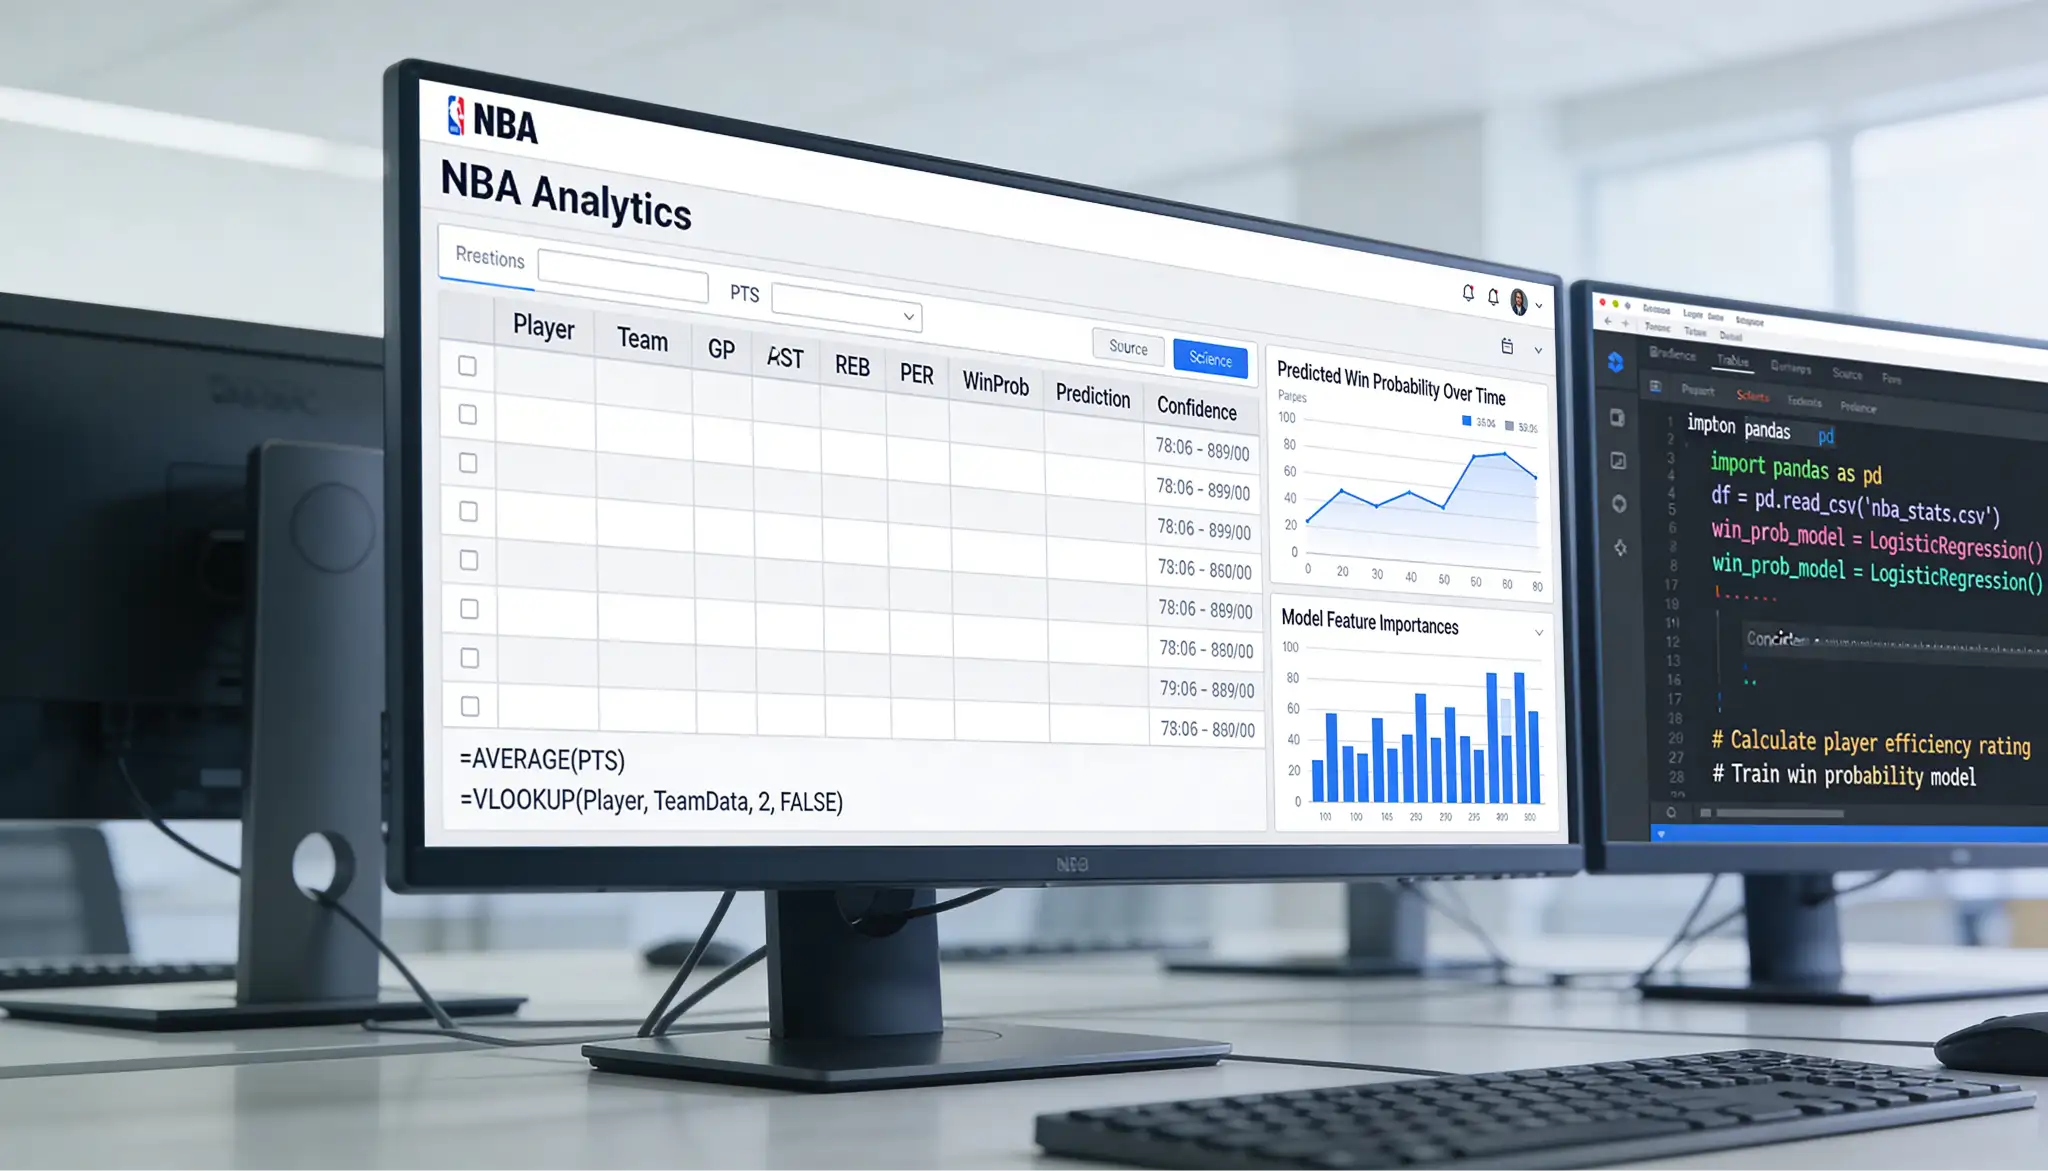
My first model was embarrassingly simple – just point differential and home court advantage. It barely beat picking games randomly. But that crude beginning taught me more about NBA betting than any tout service ever could. Each iteration added nuance: pace adjustments, rest factors, injury impacts. Five years later, that model’s descendant generates consistent edge because I understand every assumption inside it. The journey from simple to sophisticated transforms how you see the game.
A successful prediction system is ultimately designed to assist you in finding value in NBA betting markets consistently.
Compare your model’s projections with the latest odds available on the leading NBA betting site in the UK.
Betting models systematise your analysis into repeatable frameworks. Rather than relying on gut feeling or memory, models process consistent inputs to generate outputs you can compare against market lines. When your model disagrees with the market, you have identified a potential bet – assuming your model captures reality better than bookmaker assessments.
For UK bettors, model building offers particular advantages. The distance from American sports culture means you might naturally see the NBA more analytically than emotionally. You are less likely to overrate your favourite team or underrate rivals based on fandom. This detachment suits quantitative approaches that prioritise data over narrative.
Basic NBA Prediction Systems: Validating Betting Data
The NBA generates over 11 billion dollars in annual revenue, with sophisticated bettors deploying advanced models to capture edges. But every complex model began with simple foundations that aspiring model builders should understand first.
Point differential provides the simplest predictive metric. A team that outscores opponents by five points per game is approximately five points better than average. When they play a team that loses by five points per game, you would project a ten-point margin before adjustments. This basic approach works surprisingly well.
Home court adjustment adds the second layer. Historical NBA home advantage runs approximately 2.5-3 points. Add this to your point differential projection when the better team hosts; subtract it when they visit. Your projected spread now incorporates location.
Pace adjustment refines scoring comparisons. A team averaging 115 points in games with 100 possessions differs from one averaging 115 in games with 110 possessions. Efficiency per possession – offensive and defensive rating – provides more stable metrics than raw points.
Recent form adjustments capture teams improving or declining through a season. A simple approach weights recent games more heavily than early-season results. A more sophisticated approach might use rolling averages or exponential decay.
Test your simple model before adding complexity. If basic point differential already produces edge, you have a foundation to build upon. If it performs no better than random, adding more factors will not solve fundamental problems.
Data Sources
Around 58% of American bettors place wagers on NBA games, but few access the statistical depth that serious model builders require. Understanding available data sources helps construct informed models.
The NBA provides official statistics through its stats portal. Box scores, play-by-play data, shot tracking, and player tracking information are accessible for free. This official source ensures accuracy and consistency that third-party aggregators might compromise.
Basketball Reference offers historical data and advanced metrics in accessible format. Their calculated statistics – win shares, box plus-minus, value over replacement – save you from recreating established formulas. This resource has become standard for basketball analysis.
Cleaning Basketball Reference data includes making it accessible for your modelling needs. Export options let you download datasets for spreadsheet or programming analysis. The interface prioritises usability over raw data dumps.
Play-by-play data enables granular analysis beyond box scores. You can track how teams perform in specific situations – clutch time, following timeouts, against zone defence. This granularity allows models targeting specific market types.
Injury data requires multiple sources. No single source reliably captures all injury information in real time. Combining official team reports, beat reporter tweets, and news aggregation provides the most complete picture for models incorporating availability.
Line history data lets you backtest models against actual markets. Services tracking historical spreads and results allow you to simulate how your model would have performed betting past games. This validation helps distinguish genuine edge from random variation.
Key Variables
The UK gambling industry generated 16.8 billion pounds in gross gambling yield in 2025, with NBA bettors contributing through markets your model must address. Identifying which variables deserve model inclusion improves predictive accuracy.
Offensive and defensive efficiency form the core. Points per 100 possessions for and against capture team quality independent of pace. These ratings predict future performance better than raw point totals that include pace-driven variance.
Four factors analysis breaks efficiency into components. Effective field goal percentage, turnover rate, rebounding rate, and free throw rate on both ends explain most performance variation. Modelling these components lets you understand why teams perform rather than just tracking that they do.
Rest days affect performance predictably. Teams on no rest – back-to-back situations – underperform baseline. Teams with multiple rest days often outperform, though extreme rest can produce rust. Your model should incorporate rest differentials between opponents.
Travel burden accumulates across road trips. A team starting a road trip performs better than one ending a long stretch away from home. Miles travelled, time zones crossed, and consecutive road games all contribute to fatigue effects worth modelling.
Roster availability changes game projections dramatically. Star absences might swing projected spreads by five or more points. Role player absences matter less but still affect projections. Models must incorporate injury data to generate accurate game-specific outputs.
Strength of schedule contextualises performance metrics. A team with strong efficiency numbers against weak opponents might actually be worse than one with modest numbers against elite competition. Adjusting for opponent quality improves metric reliability.
Validation Methods
Building a model means nothing if you cannot validate its predictive power. Rigorous testing separates genuine models from overfitted illusions.
Out-of-sample testing uses historical data your model did not train on. Build your model using three seasons of data, then test it on a fourth season it has not seen. If performance drops dramatically, your model is overfitted to the training data rather than capturing genuine patterns.
Closing line comparison benchmarks your model against market efficiency. If your model output at game time beats closing lines consistently, you have identified value the market eventually recognised. If your outputs systematically lag closing lines, your model is worse than simply following market consensus.
Track metrics beyond simple win-loss. Brier score measures probability calibration – are your 60% predictions actually winning 60% of the time? Log loss penalises confident wrong predictions more than uncertain wrong ones. These metrics reveal model quality beyond raw accuracy.
Sample size matters enormously. A model that wins 60% over twenty games might be lucky. The same model winning 55% over five hundred games demonstrates genuine edge. Require large samples before concluding your model works.
Update and retest periodically. The NBA evolves – pace has increased, three-point shooting has transformed offence, rest management has changed. A model built on 2015 data might not apply to 2026 basketball. Regular revalidation ensures continued relevance.
From Model to Bets
A working model generates projections that must convert into betting decisions. This translation requires discipline that model outputs alone cannot provide.
Set thresholds for action. Perhaps you bet only when your model disagrees with the market by two or more points. This threshold filters marginal situations where model uncertainty might exceed apparent edge. Stricter thresholds mean fewer bets but higher average quality.
Size bets according to edge magnitude. A game where your model shows three points of value deserves larger stakes than one showing one point. Kelly criterion provides mathematical framework for optimal sizing based on edge size and bankroll.
Acknowledge model limitations honestly. Your model captures some reality but misses other factors. It cannot account for locker room chemistry, coaching adjustments during games, or referee tendencies. Maintain humility about model completeness.
Combine model outputs with qualitative factors. Perhaps your model likes a team, but you know from watching that their star is visibly hobbled despite playing. Model outputs inform decisions; they should not dictate them entirely.
Track model performance continuously. Log every bet your model recommends, whether you take it or not. Over time, assess whether model recommendations actually produce value. A model that seemed promising might prove worthless across sufficient trials – better to discover this through tracking than through bankroll depletion. The comprehensive guide to NBA spread betting integrates model-based approaches with broader handicapping frameworks.
Do I need programming skills to build an NBA betting model?
Basic models can be built in spreadsheets without programming. However, more sophisticated models benefit from programming skills – Python is popular for sports modelling. You can start simple and develop technical skills as your modelling ambitions grow. The key is beginning with a workable approach rather than waiting for perfect capabilities.
What data do I need for an NBA betting model?
At minimum, you need team performance statistics like offensive and defensive efficiency, home-away records, and recent form. More sophisticated models add rest days, travel burden, injury data, and player-level metrics. Basketball Reference and the official NBA stats site provide free access to most required data.
Created by the ”how to bet nba” editorial team.